
Key Findings at a Glance
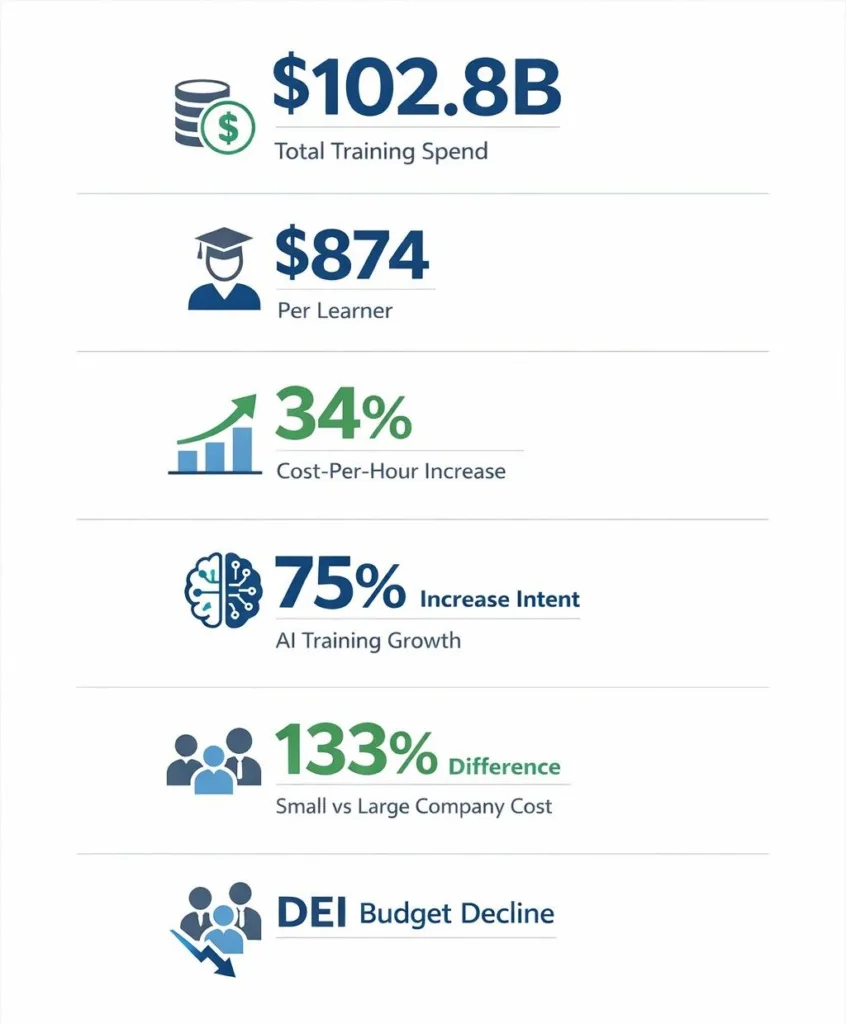
$102.8 billion – total U.S. corporate training expenditure in 2025, a 4.9% increase from $98 billion in 2024. (Source: Training Magazine, 2025)
$874 per learner – the 2025 average cost to train one employee, up from $774 in 2024 – the largest single-year per-learner cost increase in five years.
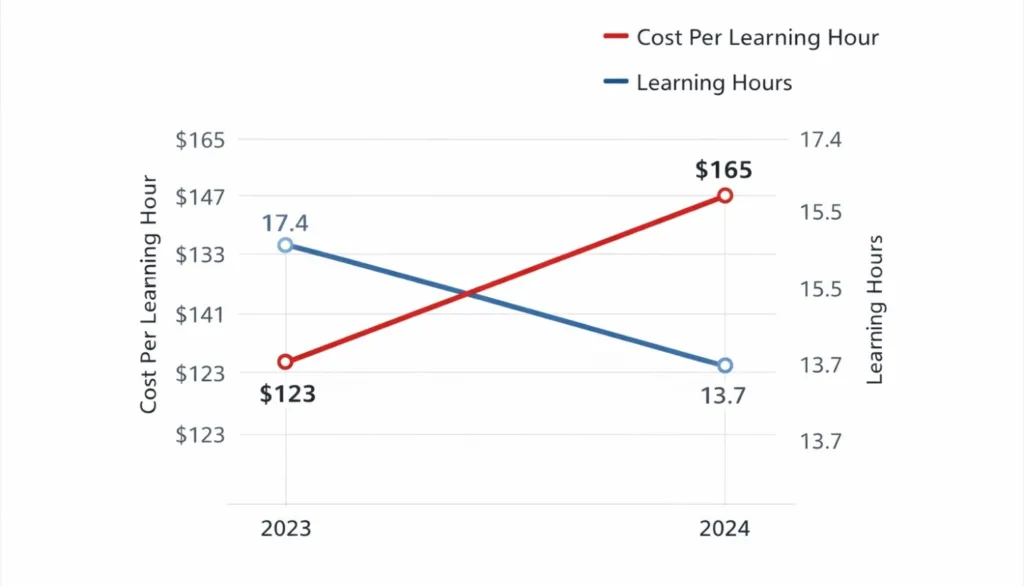
34% cost-per-hour surge: the average cost per formal learning hour jumped from $123 in 2023 to $165 in 2024, signalling a structural shift in how training is delivered and priced. (Source: ATD, 2025)
Financial services leads sector spend at $1,097 per employee annually; credit unions lead all sub-sectors at $1,331 per employee per year.
AI training now a top-3 priority: 25% of organisations plan to increase AI training funding in 2026, and 75% expect to increase AI-related spending in the next fiscal year. (Source: ATD, 2025)
Small companies pay more per learner: small firms spend $1,091 per learner vs. $468 for large enterprises – a 133% premium that reflects the absence of scale economies.
DEI budgets collapse: organisations planning DEI funding increases fell from 24% in 2024 to just 3% in 2025, the sharpest single-year decline in any L&D category on record.
63% of L&D professionals expect budgets to increase or hold steady in 2026, even as total formal learning hours per employee continue to fall.
Here is a number that should stop every L&D leader cold: the cost per formal learning hour used rose 34 percent year-over-year in 2024 – from $123 to $165 per hour – even as the average number of formal learning hours per employee fell from 17.4 to 13.7. In other words, organisations are paying sharply more to deliver sharply less training. That paradox defines the central tension in corporate L&D entering 2026.
The headline numbers tell part of the story. U.S. corporate training expenditure reached $102.8 billion in 2025, a 4.9 percent rebound from $98 billion the year before, according to Training Magazine. But averages obscure the fault lines: large enterprises have cut their average budgets from $13.3 million to $11.7 million, while small organisations are spending $333,305 on average – and somehow delivering more learning hours per dollar than their larger counterparts. Industry sector, company size, and strategic maturity are now the primary determinants of whether a training budget is a competitive asset or a sunk cost.
It is designed to answer three questions: How much should your organisation be spending? How does your spend compare to your industry peers? And where should the new budget go first?
Finding 1: The U.S. Training Market Has Crossed $100 Billion – and the Mix Is Shifting Decisively
U.S. training expenditures rose 4.9% to $102.8 billion in 2025 after a contraction to $98 billion in 2024, according to Training Magazine. But the composition of that spend has changed fundamentally. Payroll for training staff grew 7% to $64.7 billion, while spending on outside products and services surged 29% to $16 billion. Travel, facilities, and equipment costs fell to $22.1 billion. Organisations are buying less real estate and more software.
This shift carries direct implications for LMS buyers. When organisations reduce their fixed-cost training infrastructure (classrooms, travel) while increasing vendor spend, they are – by definition – accelerating their migration to digital learning platforms. The $290,987 average per-organisation spend on learning tools and technologies in 2025 (up from $268,397 in 2024) is the clearest proxy for LMS budget available in public benchmarking data.
What to do: If your organisation’s technology spend is below $290,987 and you have more than 100 employees, you are most likely underinvesting in learning infrastructure relative to U.S. peers. Benchmarking your LMS total cost of ownership against this figure is a defensible starting point for a budget conversation with your CFO. See the Training Magazine Industry Report for the full expenditure breakdown by company size.
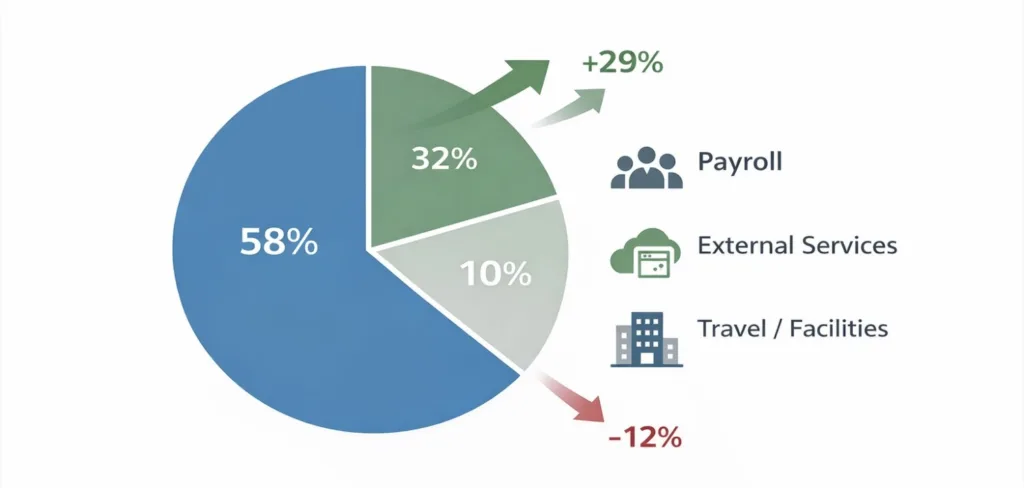
Table 1: Training Spend by Company Size (2025 Benchmarks)
| Company Size | Avg. Annual Budget | Cost Per Learner | Avg. Training Hours/Employee |
|---|---|---|---|
| Large (10,000+ employees) | $11.7 million | $468 | 62 hours |
| Midsize (1,000–9,999) | $1.6 million | $782 | 43 hours |
| Small (100–999 employees) | $333,305 | $1,091 | 42 hours |
Source: Training Magazine 2025 Training Industry Report. Note: large company budgets are down from $13.3M in 2024; small company budgets are down from $374,207.
Finding 2: Industry Vertical Is the Strongest Predictor of Per-Employee Training Spend
Sector-level benchmarks reveal a spend range of nearly 3:1 between the highest and lowest investing industries. Financial services organisations spend an average of $1,097 per employee annually on training, with credit unions leading all sub-sectors at $1,331 per employee – driven primarily by mandatory compliance, fraud detection, and regulatory change programmes. Retail and wholesale organisations report the highest per-learner investment at $1,046 per learner, followed by services organisations at $944 per learner.
Manufacturers and distributors occupy a paradoxical position: they show the greatest tendency for budget growth in 2025 and deliver the highest average training hours overall (64 hours per employee), yet their per-learner costs remain lower than services sectors because they rely more heavily on on-the-job and structured ILT delivered at scale.
The healthcare sector stands out for a different reason: high staff turnover (averaging 18% annually, rising to 38% among younger workers) creates a compounding training cost that does not appear in standard per-employee spend benchmarks. Continuous onboarding, mandatory certification renewal, and compliance training effectively double the real cost of healthcare workforce development relative to what point-in-time surveys capture.
What to do: Use the table below to identify whether your sector peers are increasing or decreasing investment. Manufacturers and service-sector organisations have the strongest tailwinds for 2026 budget requests; mid-market technology and financial services teams should prepare to defend existing budgets against consolidation pressure. For deeper sector benchmarking, consult the ATD 2025 State of the Industry report.
Explore the manufacturing training needs assessment to guide budget allocation.
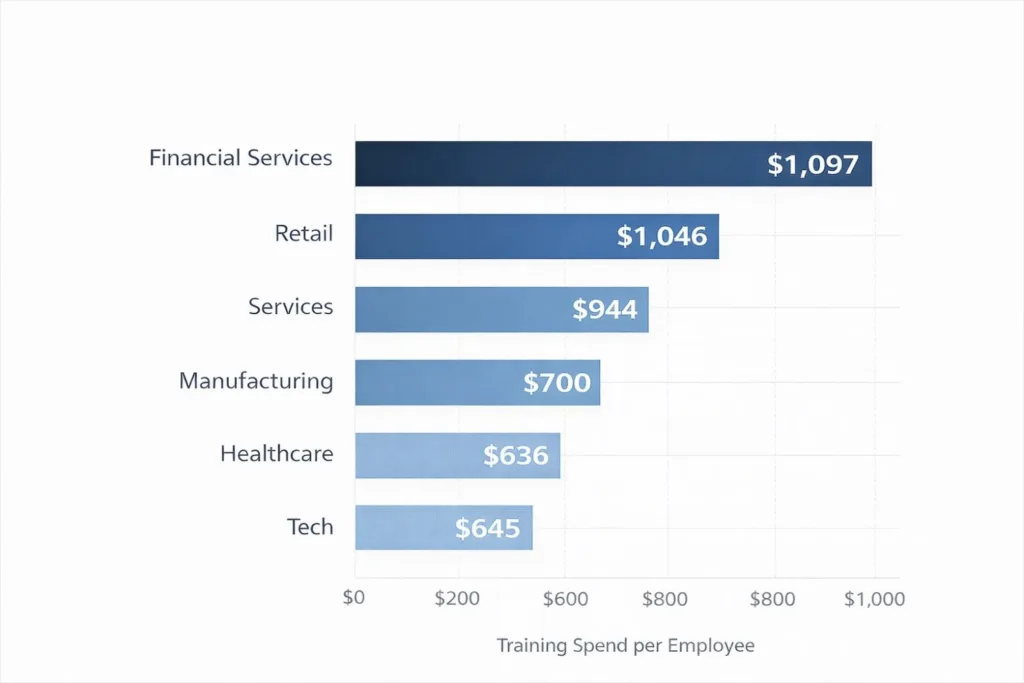
Table 2: Training Budget Benchmarks by Industry Vertical
| Industry | Avg. Spend / Employee | Budget Trend 2025 | Primary Training Focus |
|---|---|---|---|
| Financial Services | $1,097–$1,331 | Stable / Slight growth | Compliance, fraud detection |
| Retail & Wholesale | $1,046 (per learner) | Growing | Customer service, product skills |
| Services | $944 (per learner) | Growing | Management, interpersonal |
| Manufacturing / Distribution | Variable (high hours) | Strongest budget gains | Safety, ILT, onboarding |
| Healthcare | High (turnover-driven) | Stable | Compliance, onboarding, VR drills |
| Technology / IT | Variable by sub-sector | AI-driven growth | AI/ML, cybersecurity, upskilling |
Sources: Training Magazine 2025 Industry Report; Rcademy Global Corporate Training Spend Analysis 2025; ATD 2025 State of the Industry.
Finding 3: AI Training Is the Fastest-Growing Budget Line – but Execution Lags Intent
Seventy-five percent of organisations expect to increase AI-spending in their next fiscal year, and 25% have already earmarked AI training as a 2026 funding priority, per ATD. The LinkedIn 2025 Workplace Learning Report reinforces this: 80% of L&D professionals regard AI as important in learning strategies, and 4 in 5 employees report wanting to learn more about AI applications in their specific role.
Yet execution remains patchy. Only 25% of L&D professionals routinely factor AI into their strategy, and ATD notes that AI practical skills training – covering prompt writing, problem-solving with AI, and AI ethics – is offered by 55% of organisations but with significant variation in depth and measurable outcomes.
The World Economic Forum’s Future of Jobs Report 2025 provides the urgency context: 39% of workers’ current skills will be outdated by 2030, with AI and big data, networks and cybersecurity, and technological literacy identified as the three fastest-rising skill categories between now and then. Organisations that build AI training infrastructure now are buying a five-year skills buffer; those that delay are purchasing a five-year skills deficit.
What to do: Separate your AI training budget into two distinct lines – AI technical skills (machine learning, programming) and AI practical skills (prompt engineering, workflow integration). Track each separately in your LMS. Organisations that do this are 15% more likely to rate their L&D function as aligned with business strategy, per Hemsley Fraser’s 2024 L&D Impact Survey.
Practitioner Insight: Budget AI Training in Phases, Not as a Lump Sum
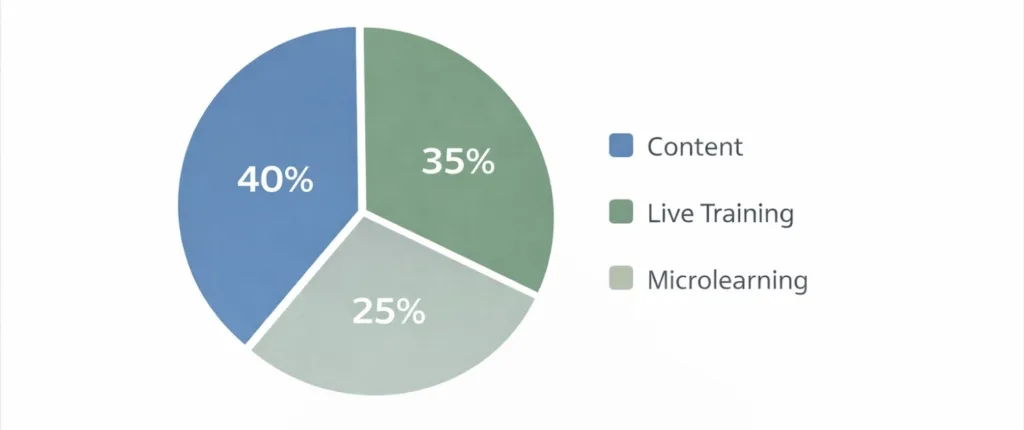
L&D teams that treat AI training as a single budget item routinely overspend on content and underinvest in reinforcement. A proven framework: allocate 40% to initial skills assessment and content curation, 35% to cohort-based live or VILT delivery, and 25% to spaced-repetition microlearning modules that reinforce concepts over 60–90 days. This split maps to the way adults retain AI skills: short, frequent practice outperforms single immersive sessions by a factor of 2:1 in knowledge retention at the 30-day mark. Ask your LMS vendor whether their platform supports xAPI-tracked spaced repetition before committing budget to AI content.
Finding 4: Compliance and Management Training Absorb the Largest Shares – Creating a Squeeze on Strategic Spend
Mandatory compliance training and management/supervisory development each absorb 13% of total training budgets – the largest categories by spend allocation in 2025. IT/systems training and onboarding each represent 11%. Together, these four “operational” categories consume roughly half of the average corporate training budget before a single dollar reaches strategic or skills-forward initiatives.
For the 13th consecutive year, management and supervisory training is the category most likely to receive increased funding in 2026 (cited by 30% of organisations). This consistency reflects a structural reality: middle management quality is the leading driver of team performance and employee retention, and organisations have learned – through a decade of data – that underinvesting here is expensive. ATD’s 2025 data found that more than 90% of organisations are facing a major or minor leadership skills gap.
The DEI exception deserves particular attention. Organisations planning to increase DEI training funding fell from 24% in 2024 to just 3% in 2025 – by far the sharpest single-year reversal in any training category in recent history, driven by shifts in U.S. government policy. Eleven percent said they will scale back DEI programmes and 6% will eliminate them entirely. L&D leaders should note this is a budget reallocation event, not a workforce needs event – the employee cohorts these programmes serve have not changed. See Training Magazine’s full dataset for category-level trends.
Table 3: Average Training Budget Allocation by Category (2025)
| Training Category | % of Budget | 2026 Funding Direction |
|---|---|---|
| Mandatory / Compliance Training | 13% | Stable |
| Management & Supervisory | 13% | ↑ Increase (30% of orgs) |
| IT / Systems Training | 11% | ↑ Increase (AI-driven) |
| Onboarding & New Employee | 11% | ↑ Increase (21% of orgs) |
| AI Skills Training | Growing | ↑ Strong increase (25% of orgs) |
| Interpersonal Skills | Variable | ↑ Increase (22% of orgs) |
| DEI Training | Declining | ↓ Sharp decline (3% of orgs planning increases) |
| Learning Technology (LMS, tools) | 13% avg. | ↑ Increase ($290,987 avg. per org) |
Source: Training Magazine 2025 Training Industry Report; ATD 2025 State of the Industry.
Finding 5: Formal Learning Hours Are Falling – and That Is Not a Crisis, It Is a Recalibration
Average formal learning hours per employee have declined every year since 2020, reaching 13.7 hours in 2024 (per ATD) and 40 hours in 2025 under Training Magazine’s broader methodology. These figures are not directly comparable – ATD measures formal structured learning only; Training Magazine includes all employee training time – but both directional trends point the same way: down. The TalentLMS 2026 L&D Report offers a useful counterpoint: employee satisfaction with L&D has climbed from 75% in 2022 to 84% in 2025. Employees are receiving less formal training and are happier about it.
The explanation is structural. Microlearning, embedded on-the-job coaching, and AI-assisted skill-building tools are absorbing learning time that previously sat in formal programmes. The LinkedIn Workforce Learning Report noted that 47% of L&D teams planned to implement microlearning, and that organisations with strong learning cultures enjoy 57% higher retention rates and 23% higher internal mobility than those with weaker learning commitments. The format has shifted from scheduled to ambient; the outcome has not.
What to do: Do not benchmark your organisation’s training effectiveness on formal hours alone. Pair formal hour data with LMS engagement metrics, skill assessment scores, and time-to-productivity for new hires. Organisations investing in LMS platforms capable of tracking informal learning via xAPI/Tin Can protocols have a structural measurement advantage.
LMSpedia Analysis: What This Data Means for Buyers in 2026
The story told by the aggregate data is about averages. The story that matters for LMS buyers is about what separates the organisations in the top quartile from the rest – and that story is harder to read in any single source.
The real insight: organisations are not underfunding training. They are mismeasuring it.
Consider the per-learner data. Large enterprises spend $468 per learner and deliver 62 training hours annually. Small companies spend $1,091 per learner and deliver 42 training hours. On the surface, small companies look inefficient – higher spend, lower output. But formal hours is the wrong unit. Small companies report higher employee satisfaction with L&D (per TalentLMS) and are more likely to be investing in targeted, business-critical skill programmes rather than compliance-volume training.
The real cost crisis is not per-learner spend. It is the 34% year-on-year increase in cost per learning hour used – a unit that captures both the price of content and the reality that employees are consuming less of it. When you pay $165 for every formal hour of learning actually consumed (up from $123 the year before), and your LMS cannot tell you which content is not being completed, you are flying financially blind.
The organisations winning in 2026 are not those with the largest budgets. They are those with the tightest feedback loops between learning spend and measurable business output. That requires an LMS with robust analytics, xAPI tracking, and HRIS integration – not just a content library. The Brandon Hall Group research has consistently found that organisations in the top quartile of learning analytics maturity report 22% higher retention and 19% faster project execution. Those two numbers, presented to a CFO, justify virtually any modern LMS investment.
A final observation for HR Directors evaluating platforms: the 63% of L&D professionals who expect budgets to hold or grow in 2026 are largely at organisations that already demonstrated ROI in previous cycles. Budget stability is not the cause of good outcomes – it is the consequence. Investing in a platform that surfaces measurable outcomes before your next budget cycle is not an LMS decision; it is a survival strategy. The G2 Grid Report for LMS remains a useful starting point for peer review data when beginning platform evaluation.
Frequently Asked Questions
Q1. How much do companies spend on employee training per year?
U.S. organisations spent an average of $874 per learner in 2025 (Training Magazine) and $1,054 per employee in direct learning expenditure in 2024 (ATD). Total U.S. corporate training expenditure reached $102.8 billion in 2025. Budgets vary significantly by company size and industry sector – see Tables 1 and 2 above.
Q2. What percentage of revenue do companies typically spend on training?
ATD’s 2025 State of the Industry found organisations are investing 2.9% of revenue in learning and development – the highest ratio recorded in the last five years. This figure varies by sector: financial services and highly regulated industries typically invest above this average.
Q3. Which industries spend the most on employee training?
Financial services leads with $1,097–$1,331 per employee annually. Retail and wholesale organisations spend $1,046 per learner; services organisations spend $944. Manufacturing delivers the highest volume in training hours (64 hours per employee on average) and shows the strongest budget growth momentum in 2025.
Q4. Why do small companies spend more per learner than large enterprises?
Small companies (100–999 employees) spend $1,091 per learner vs. $468 for large enterprises. Large organisations benefit from scale economies: content development and LMS administration costs are spread across many more learners. Small companies purchasing the same content or the same LMS seat pay a proportionally higher unit cost without volume discounts.
Q5. How is AI changing corporate training budgets in 2026?
AI is the fastest-growing budget line in corporate L&D. Seventy-five percent of organisations expect to increase AI-related spending in their next fiscal year, and 25% have identified AI training as a top funding priority for 2026. AI is also reshaping delivery: AI-personalised learning paths, spaced repetition tools, and chatbot-based coaching are reducing the cost per effective learning hour over time, even as the raw cost per formal hour has risen.
Q6. What is the average training budget for a midsize company?
Midsize companies (1,000–9,999 employees) maintained an average annual training budget of approximately $1.6 million in 2025, essentially flat from $1.7 million in 2024. Midsize companies are also the most likely size segment to have reported budget decreases (23%) and face the greatest pressure to justify L&D spending relative to revenue.
Q7. How should L&D leaders benchmark their training budget?
Use three benchmarks simultaneously: (1) per-employee direct spend vs. your industry vertical average; (2) cost per formal learning hour used vs. the $165 national average; (3) technology spend as a percentage of total training budget vs. the 13% average. Any single benchmark in isolation can be misleading – a low cost-per-learner figure may simply reflect a programme that few employees actually complete.